I’ve read somewhere that, in elections, the position of a candidate in the ballot affects how much votes are cast for her. Does this happens in the Portuguese Local Elections for câmara municipal? Let’s take a look.
Unfortunately, I can only find computer-readable data on ballot order for the 2013 elections. There is a PDF with this information for 2005, but my efforts to automatically extract data from the document were in vain (I tried some Python PDF extraction tools). I’ve sent an e-mail to the relevant government entity asking for the missing data, but I only expect an answer 20 years from now. As we only got so much to live, I’m going forward with the analysis only with the 2013 data.
The data and code I’m using is available here and here.
I’m basically following the analysis done in this paper, section 5. I analyse the data using the same model as the author of the paper: 
VitELECT is the observed percentage of votes cast for candidate party i in election t and Vit is the true preference of voters in case they are uninfluenced by ballot position. If the voters are indeed uninfluenced, then VitELECT = Vit. POSit corresponds to the candidate ballot position (1 if the candidate appears first in the ballot, 2 if it appears in second place, etc.) and LENGTHit is the number of candidates in the ballot. eit is the error term (which I don’t understand well) and α, β and γ are parameters to estimate. If voters are influenced by ballot position, then β will be significantly different from 0 - if negative, it means candidates down the ballot will tend to receive less votes.
Vit* is an unobserved variable since we can’t read people’s minds before the elections. However, from what I understood from the paper, we can omit this variable from the model if we know it is not related to β, the parameter we are studying. Since the ballot order in Portugal is random, this is the case.
Let’s assume for the moment what was most intuitive from me in the beginning and just check the correlation between the position of a candidate in the ballot and the percentage of votes. This corresponds to assuming that γ is 0. 
| coef | std err | t | P>|t| | [0.025 | 0.975] | |
|---|---|---|---|---|---|---|
| β (ballot position) | -1.1492 | 0.367 | -3.129 | 0.002 | -1.870 | -0.429 |
These are the results of a regression analysis using the ordinary least squares method. It seems there is a negative correlation between position in the ballot and percentage of votes received. And indeed, looking at the statistics for the β coefficient we can see that with 95% confidence the value of this coefficient is between -0.429 and -1.870. If we take this results at face value, this means that each position further down the ballot translates, with 95% confidence, to less 0.429% to 1.870% of votes received by the candidate.
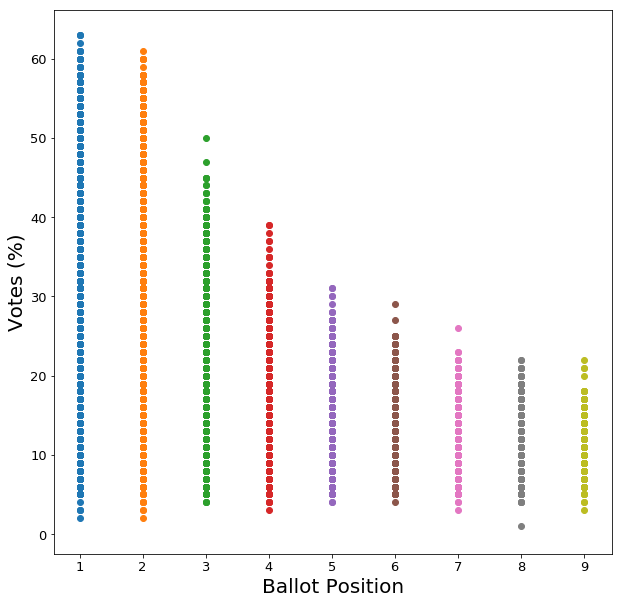
But there’s a catch. Even if voters are unaffected by ballot position, it is still expected to see less percentage of votes for candidates further down the ballot. We can better see this through an example. Consider positions #1 and #5. Position #1 always happens, regardless of the ballot length. So it appears in cases in which the ballot only has two positions, a case in which the votes are not much diluted between the candidates. And it also happens in longer ballots, in which the votes are more diluted between the candidates. On the other hand, the position #5 appears just in cases of ballot length equal or greater than 5, cases in which the votes are already significantly diluted between the candidates.
To test this theory I’ve simulated a number of elections, 300 for each ballot length between 2 and 9. In this simulation the votes are random. As you can see from the plot bellow, even though the votes are random, there’s still a relation between position in ballot and percentage of votes.
So, we should incorporate the ballot length into our model and not assume that γ is 0. Here are the results of the regression analysis when we use the complete model:
| coef | std err | t | P>|t| | [0.025 | 0.975] | |
|---|---|---|---|---|---|---|
| β (ballot position) | 0.7178 | 0.394 | 1.824 | 0.068 | -0.054 | 1.490 |
| γ (ballot length) | -4.7020 | 0.442 | -10.644 | 0.000 | -5.56 | -3.835 |
Highlighting what we just saw, the γ coefficient is significantly negative. On the other hand, the effect of βdisappears when we consider the ballot length, which means that Portuguese voters are not affected by the order of candidates in the ballot.
I guess this is good news. :)
References:
Matsusaka, J.G. Public Choice (2016) 167: 257. doi:10.1007/s11127-016-0340-9